Complete results and additional material for the article “UnPART: PART without the 'partial' condition of it”
2018-11-05
This page contains the full tables related to the work presented in the article:
Igor Ibarguren, Jesús M. Pérez, Javier Muguerza, Ibai Gurrutxaga and Olatz Arbelaitz.
"UnPART: PART without the 'partial' condition of it". Information Sciences (2018). Vol. 465, pp 505-522.
First, we present the table with the characteristics for the 96 datasets used in this study, divided into three contexts.
Then, for each of the evaluation measures, we include the full tables of the results related to the different proposed PART-like algorithm and their base decision trees, companion figures for the statistical significance, and pair-wise p-value tables.
All the tables of results can be downloaded as an Excel document or as a CSV file.
Content
Index of Tables
Table 1. Description of standard
datasets.
Table 2.
Description of imbalanced datasets.
Index of Figures
Figure 2.
Friedman Aligned Ranks for the C4.5-based and CHAID*-based algorithms for the
AUC measure
Figure 5.
Friedman Aligned Ranks for the C4.5-based and CHAID*-based algorithms for the
Time measure
1. Datasets characteristics
This section contains the tables with the characteristics for the 96 datasets from the KEEL repository used in this study. First we present the datasets from the first (Standard) context and then from the second (Imbalanced) context. SMOTE-preprocessed datasets have have the same characteristics as the datasets from Table 2, but the minority class oversampled until it has the majority class’ size.
Table 1. Description of standard datasets.¡Error!
Marcador no definido.
|
Data set |
#Ants |
#Examples |
#Classes |
%min |
%maj |
Size Of Min. Class |
Size of Maj. Class |
|
|
lymphography |
18 |
148 |
4 |
1.36% |
54.73% |
2 |
81 |
|
|
ecoli |
7 |
336 |
8 |
0.6% |
42.56% |
2 |
143 |
|
|
car |
6 |
1728 |
4 |
3.77% |
70.03% |
65 |
1210 |
|
|
nursery |
8 |
1296 |
5 |
0.08% |
33.34% |
1 |
432 |
|
|
cleveland |
13 |
297 |
5 |
4.38% |
53.88% |
13 |
160 |
|
|
zoo |
17 |
101 |
7 |
3.97% |
40.6% |
4 |
41 |
|
|
glass |
9 |
214 |
6 |
4.21% |
35.52% |
9 |
76 |
|
|
flare |
10 |
1066 |
6 |
4.04% |
31.06% |
43 |
331 |
|
|
abalone |
8 |
418 |
22 |
0.24% |
16.51% |
1 |
69 |
|
|
balance |
4 |
625 |
3 |
7.84% |
46.08% |
49 |
288 |
|
|
dermatology |
33 |
358 |
6 |
5.59% |
31.01% |
20 |
111 |
|
|
hepatitis |
19 |
80 |
2 |
16.25% |
83.75% |
13 |
67 |
|
|
newthyroid |
5 |
215 |
3 |
13.96% |
69.77% |
30 |
150 |
|
|
haberman |
3 |
306 |
2 |
26.48% |
73.53% |
81 |
225 |
|
|
breast |
9 |
277 |
2 |
29.25% |
70.76% |
81 |
196 |
|
|
german |
20 |
1000 |
2 |
30% |
70% |
300 |
700 |
|
|
wisconsin |
9 |
630 |
2 |
34.61% |
65.4% |
218 |
412 |
|
|
contraceptive |
9 |
1473 |
3 |
22.61% |
42.71% |
333 |
629 |
|
|
tictactoe |
9 |
958 |
2 |
34.66% |
65.35% |
332 |
626 |
|
|
pima |
8 |
768 |
2 |
34.9% |
65.11% |
268 |
500 |
|
|
magic |
10 |
1902 |
2 |
35.13% |
64.88% |
668 |
1234 |
|
|
wine |
13 |
178 |
3 |
26.97% |
39.89% |
48 |
71 |
|
|
bupa |
6 |
345 |
2 |
42.03% |
57.98% |
145 |
200 |
|
|
heart |
13 |
270 |
2 |
44.45% |
55.56% |
120 |
150 |
|
|
australian |
14 |
690 |
2 |
44.5% |
55.51% |
307 |
383 |
|
|
crx |
15 |
653 |
2 |
45.33% |
54.68% |
296 |
357 |
|
|
vehicle |
18 |
846 |
4 |
23.53% |
25.77% |
199 |
218 |
|
|
penbased |
16 |
1100 |
10 |
9.55% |
10.46% |
105 |
115 |
|
|
ring |
20 |
740 |
2 |
49.6% |
50.41% |
367 |
373 |
|
|
iris |
4 |
150 |
3 |
33.34% |
33.34% |
50 |
50 |
|
|
Mean |
11.77 |
638.93 |
4.27 |
21% |
50% |
139 |
319.93 |
|
|
Median |
9.5 |
521.5 |
3 |
23% |
54% |
73 |
209 |
Table 2. Description of
imbalanced datasets.
|
Data set |
#Atts. |
#Examples |
Imbalance |
Size Of Min. Class |
Size of Maj. Class |
|
Abalone19 |
8 |
4174 |
0.77% |
32 |
4142 |
|
Yeast6 |
8 |
1484 |
2.49% |
37 |
1447 |
|
Yeast5 |
8 |
1484 |
2.96% |
44 |
1440 |
|
Yeast4 |
8 |
1484 |
3.43% |
51 |
1433 |
|
Yeast2vs8 |
8 |
482 |
4.15% |
20 |
462 |
|
Glass5 |
9 |
214 |
4.2% |
9 |
205 |
|
Abalone9vs18 |
8 |
731 |
5.65% |
41 |
690 |
|
Glass4 |
9 |
214 |
6.07% |
13 |
201 |
|
Ecoli4 |
7 |
336 |
6.74% |
23 |
313 |
|
Glass2 |
9 |
214 |
8.78% |
19 |
195 |
|
Vowel0 |
13 |
988 |
9.01% |
89 |
899 |
|
Page-blocks0 |
10 |
5472 |
10.23% |
560 |
4912 |
|
Ecoli3 |
7 |
336 |
10.88% |
37 |
299 |
|
Yeast3 |
8 |
1484 |
10.98% |
163 |
1321 |
|
Glass6 |
9 |
214 |
13.55% |
29 |
185 |
|
Segment0 |
19 |
2308 |
14.26% |
329 |
1979 |
|
Ecoli2 |
7 |
336 |
15.48% |
52 |
284 |
|
New-thyroid1 |
5 |
215 |
16.28% |
35 |
180 |
|
New-thyroid2 |
5 |
215 |
16.89% |
36 |
179 |
|
Ecoli1 |
7 |
336 |
22.92% |
77 |
259 |
|
Vehicle0 |
18 |
846 |
23.64% |
200 |
646 |
|
Glass0123vs456 |
9 |
214 |
23.83% |
51 |
163 |
|
Haberman |
3 |
306 |
27.42% |
84 |
222 |
|
Vehicle1 |
18 |
846 |
28.37% |
240 |
606 |
|
Vehicle2 |
18 |
846 |
28.37% |
240 |
606 |
|
Vehicle3 |
18 |
846 |
28.37% |
240 |
606 |
|
Yeast1 |
8 |
1484 |
28.91% |
429 |
1055 |
|
Glass0 |
9 |
214 |
32.71% |
70 |
144 |
|
Iris0 |
4 |
150 |
33.33% |
50 |
100 |
|
Pima |
8 |
768 |
34.84% |
268 |
500 |
|
Ecoli0vs1 |
7 |
220 |
35% |
77 |
143 |
|
Wisconsin |
9 |
683 |
35% |
239 |
444 |
|
Glass1 |
9 |
214 |
35.51% |
76 |
138 |
|
Mean |
9.39 |
919.94 |
17.61% |
120 |
799.94 |
|
Median |
8 |
482 |
15.48% |
52 |
444 |
2.
Results for the C4.5-based and CHAID*-based algorithms for all 6 metrics over
each dataset context.
This section includes the full tables of the results related to the C4.5-based and CHAID*-based algorithms (UnPART, BFPART, PART, and C4.5/CHAID*) for the six performance metrics used in the study: Kappa, GM, AUC, Number of Rules, Length, and Time. For Length the unit of measurement is the number of decisions per rule or tree branch. Computational cost is measured in milliseconds. Numbers in bold indicate the best value for that particular dataset. In these tables we have treated C4.5 as reference for all algorithms, as it is the base for UnPART_C45, BFPART_C45, PART_C45, and the CHAID* algorithm also takes elements from C4.5. Cells with gray background indicate algorithms performing better than C4.5.
The figures used in the article to show the results of the statistical significance only show if the differences are significant at the .05 level, but do not show the actual p-values. In order to complement those figures, we include a table with all the pair-wise p-values for the Bergman-Hommel test. In these tables, the algorithms are ordered according to their Friedman Aligned Rank, from lowest to highest.
We also include a Figure for each global analysis for statistical significance performed in the article. Unlike the figures in the article, these graphically represent the differences between the Friedman Aligned Ranks for each algorithm.
2.1
Results for Kappa and GM measures
Table 3. Kappa values for the C4.5-based and CHAID*-based algorithms for each of the 30 standard datasets
|
|
C4.5-based |
CHAID*-based |
||||||
|
UnPART |
BFPART |
PART |
C4.5 |
UnPART |
BFPART |
PART |
CHAID* |
|
|
lymphography |
.5593 |
.5758 |
.4688 |
.5367 |
.5354 |
.5764 |
.6374 |
.5304 |
|
ecoli |
.7359 |
.6986 |
.7289 |
.7030 |
.6981 |
.7065 |
.6814 |
.6805 |
|
car |
.9033 |
.9068 |
.8894 |
.7986 |
.8924 |
.8900 |
.8971 |
.9076 |
|
nursery |
.8424 |
.8482 |
.8753 |
.8341 |
.8478 |
.8477 |
.8947 |
.8684 |
|
cleveland |
.2789 |
.2187 |
.2444 |
.2257 |
.2738 |
.2390 |
.2366 |
.2256 |
|
zoo |
.9215 |
.9215 |
.9215 |
.9215 |
.9218 |
.9218 |
.9218 |
.9398 |
|
glass |
.5394 |
.5526 |
.6076 |
.5494 |
.5085 |
.5085 |
.5124 |
.5391 |
|
flare |
.6668 |
.6751 |
.6470 |
.6676 |
.6707 |
.6559 |
.6613 |
.6893 |
|
abalone |
.1035 |
.0918 |
.0683 |
.0962 |
.1314 |
.1326 |
.1497 |
.1533 |
|
balance |
.6447 |
.6447 |
.6494 |
.5922 |
.6175 |
.6209 |
.6262 |
.5996 |
|
dermatology |
.9226 |
.9226 |
.9226 |
.9045 |
.9335 |
.9335 |
.9300 |
.9383 |
|
hepatitis |
.2520 |
.2520 |
.5485 |
.1115 |
.1330 |
.0899 |
.2285 |
.1908 |
|
newthyroid |
.8795 |
.8795 |
.8525 |
.8519 |
.8618 |
.8618 |
.8618 |
.8686 |
|
haberman |
.1186 |
.1186 |
.0924 |
.1521 |
.0265 |
.0265 |
.0265 |
.0265 |
|
breast |
.2418 |
.2418 |
.2300 |
.2330 |
.2970 |
.2970 |
.2663 |
.2970 |
|
german |
.3124 |
.3243 |
.3333 |
.3049 |
.3158 |
.3150 |
.2705 |
.2714 |
|
wisconsin |
.8474 |
.8474 |
.8236 |
.8515 |
.8699 |
.8556 |
.8907 |
.8410 |
|
contraceptive |
.2816 |
.2641 |
.2356 |
.2845 |
.2815 |
.2896 |
.2778 |
.2909 |
|
tictactoe |
.7803 |
.7573 |
.8430 |
.6770 |
.6817 |
.6789 |
.7847 |
.7605 |
|
pima |
.3814 |
.3814 |
.4078 |
.4175 |
.4051 |
.4051 |
.3893 |
.4043 |
|
magic |
.5186 |
.5190 |
.4806 |
.5183 |
.5034 |
.4979 |
.4871 |
.5266 |
|
wine |
.8969 |
.8969 |
.8971 |
.9222 |
.8795 |
.8795 |
.8966 |
.8797 |
|
bupa |
.2867 |
.2701 |
.2594 |
.3124 |
.2613 |
.2613 |
.2424 |
.2444 |
|
heart |
.5703 |
.5384 |
.5239 |
.5636 |
.6225 |
.6537 |
.6537 |
.5489 |
|
australian |
.7156 |
.7063 |
.6742 |
.6886 |
.6845 |
.6851 |
.6681 |
.6837 |
|
crx |
.7371 |
.7184 |
.6651 |
.7194 |
.7354 |
.7194 |
.7116 |
.7172 |
|
vehicle |
.6421 |
.6248 |
.6452 |
.6185 |
.5789 |
.5707 |
.5969 |
.5902 |
|
penbased |
.8818 |
.8889 |
.8737 |
.8838 |
.8331 |
.8311 |
.8355 |
.8373 |
|
ring |
.7702 |
.7702 |
.7623 |
.7135 |
.7482 |
.7420 |
.7420 |
.7482 |
|
iris |
.9100 |
.9100 |
.9000 |
.9000 |
.9200 |
.9200 |
.9200 |
.9200 |
|
Mean |
.6047 |
.5989 |
.6024 |
.5851 |
.5890 |
.5871 |
.5966 |
.5906 |
|
Median |
.6557 |
.6599 |
.6482 |
.6431 |
.6466 |
.6548 |
.6575 |
.6400 |
This table can be downloaded as an Excel document or as a CSV file
by clicking on the following links ![]() and
and ![]() .
.
Table 4. GM values for the C4.5-based and CHAID*-based algorithms for each of the 33 imbalanced datasets
|
|
C4.5-based |
CHAID*-based |
||||||
|
UnPART |
BFPART |
PART |
C4.5 |
UnPART |
BFPART |
PART |
CHAID* |
|
|
abalone19 |
.0000 |
.0000 |
.0000 |
.0000 |
.0000 |
.0000 |
.0000 |
.0000 |
|
yeast6 |
.5660 |
.5660 |
.7333 |
.5660 |
.1302 |
.1302 |
.2359 |
.1302 |
|
yeast5 |
.8846 |
.8742 |
.8850 |
.8612 |
.7967 |
.7957 |
.8601 |
.7715 |
|
yeast4 |
.4731 |
.4731 |
.4239 |
.4208 |
.3844 |
.3844 |
.2326 |
.3844 |
|
yeast-2_vs_8 |
.3137 |
.1704 |
.1704 |
.1723 |
.7274 |
.7274 |
.7264 |
.7274 |
|
glass5 |
.8787 |
.8787 |
.8787 |
.8804 |
.9876 |
.9876 |
.9876 |
.9876 |
|
abalone9-18 |
.4173 |
.3897 |
.4157 |
.3882 |
.2983 |
.2983 |
.2930 |
.2975 |
|
glass4 |
.5836 |
.5836 |
.5836 |
.5769 |
.3397 |
.3397 |
.3397 |
.3030 |
|
ecoli4 |
.7791 |
.7791 |
.7786 |
.7777 |
.7821 |
.7821 |
.8405 |
.8123 |
|
glass2 |
.4597 |
.4597 |
.4597 |
.4427 |
.0000 |
.0000 |
.0000 |
.0000 |
|
vowel0 |
.9149 |
.9149 |
.9207 |
.9683 |
.8552 |
.9112 |
.9194 |
.8722 |
|
page-blocks0 |
.9136 |
.8944 |
.8932 |
.9225 |
.8879 |
.9001 |
.9096 |
.9002 |
|
ecoli3 |
.7227 |
.7227 |
.7290 |
.6773 |
.7003 |
.7003 |
.7003 |
.6749 |
|
yeast3 |
.8567 |
.8567 |
.8097 |
.8479 |
.8537 |
.8537 |
.8552 |
.8670 |
|
glass6 |
.7940 |
.7940 |
.7874 |
.7940 |
.7946 |
.7946 |
.7946 |
.7920 |
|
segment0 |
.9858 |
.9858 |
.9893 |
.9814 |
.9794 |
.9796 |
.9867 |
.9829 |
|
ecoli2 |
.8041 |
.8041 |
.7963 |
.8497 |
.7564 |
.7564 |
.7564 |
.7564 |
|
new-thyroid1 |
.9394 |
.9394 |
.9394 |
.9460 |
.9529 |
.9529 |
.9529 |
.9503 |
|
new-thyroid2 |
.9206 |
.9206 |
.9206 |
.9327 |
.9328 |
.9328 |
.9328 |
.9355 |
|
ecoli1 |
.8590 |
.8590 |
.8411 |
.8538 |
.8062 |
.8062 |
.8062 |
.8221 |
|
vehicle0 |
.9029 |
.9242 |
.9267 |
.9378 |
.9209 |
.9213 |
.8902 |
.9023 |
|
glass-0-1-2-3_vs_4-5-6 |
.8711 |
.8711 |
.8682 |
.9210 |
.8638 |
.8660 |
.8576 |
.8766 |
|
haberman |
.3252 |
.3252 |
.2876 |
.3563 |
.0931 |
.0931 |
.0931 |
.0931 |
|
vehicle1 |
.6362 |
.6112 |
.3773 |
.6512 |
.5063 |
.4975 |
.5113 |
.5033 |
|
vehicle2 |
.9421 |
.9514 |
.9499 |
.9453 |
.9234 |
.9284 |
.9394 |
.9221 |
|
vehicle3 |
.6581 |
.6489 |
.5071 |
.6728 |
.5250 |
.4651 |
.4939 |
.5542 |
|
yeast1 |
.6093 |
.6093 |
.5333 |
.6276 |
.6048 |
.6068 |
.5996 |
.5889 |
|
glass0 |
.7703 |
.7742 |
.7967 |
.7845 |
.7726 |
.7726 |
.7752 |
.7726 |
|
iris0 |
.9897 |
.9897 |
.9897 |
.9897 |
.9897 |
.9897 |
.9897 |
.9897 |
|
pima |
.6724 |
.6795 |
.6973 |
.7023 |
.6879 |
.6879 |
.6709 |
.6953 |
|
ecoli-0_vs_1 |
.9831 |
.9831 |
.9723 |
.9831 |
.9831 |
.9831 |
.9831 |
.9831 |
|
wisconsin |
.9365 |
.9345 |
.9347 |
.9315 |
.9445 |
.9561 |
.9521 |
.9411 |
|
glass1 |
.7065 |
.6974 |
.6503 |
.7198 |
.6493 |
.6732 |
.6732 |
.6278 |
|
Mean |
.7294 |
.7232 |
.7105 |
.7298 |
.6797 |
.6810 |
.6836 |
.6793 |
|
Median |
.7940 |
.7940 |
.7963 |
.7940 |
.7821 |
.7821 |
.7946 |
.7726 |
This table can be downloaded as an Excel document or as a CSV file by
clicking on the following links ![]() and
and ![]() .
.
Table 5. GM values for the C4.5-based and CHAID*-based algorithms for each of the 33 SMOTE-preprocessed imbalanced datasets
|
|
C4.5-based |
CHAID*-based |
||||||
|
UnPART |
BFPART |
PART |
C4.5 |
UnPART |
BFPART |
PART |
CHAID* |
|
|
abalone19 |
.0806 |
.0811 |
.1560 |
.1558 |
.0809 |
.1624 |
.1625 |
.1600 |
|
yeast6 |
.8042 |
.8042 |
.7855 |
.8048 |
.6794 |
.6122 |
.6283 |
.5637 |
|
yeast5 |
.9210 |
.9210 |
.9198 |
.9445 |
.8428 |
.8571 |
.7098 |
.7987 |
|
yeast4 |
.6952 |
.6782 |
.6954 |
.6521 |
.6151 |
.6814 |
.6043 |
.5417 |
|
yeast-2_vs_8 |
.7313 |
.7323 |
.7171 |
.7402 |
.7047 |
.6653 |
.6607 |
.6509 |
|
glass5 |
.9274 |
.9274 |
.9249 |
.8720 |
.9242 |
.6687 |
.8688 |
.9266 |
|
abalone9-18 |
.5534 |
.5845 |
.5773 |
.5319 |
.6157 |
.6260 |
.6714 |
.5169 |
|
glass4 |
.8406 |
.8406 |
.8406 |
.8443 |
.6714 |
.7097 |
.7097 |
.6673 |
|
ecoli4 |
.8184 |
.8184 |
.8468 |
.7410 |
.8123 |
.7712 |
.9060 |
.8142 |
|
glass2 |
.6600 |
.6600 |
.6754 |
.6500 |
.6053 |
.4813 |
.4993 |
.6873 |
|
vowel0 |
.9367 |
.9311 |
.8956 |
.9357 |
.8831 |
.8639 |
.8343 |
.8452 |
|
page-blocks0 |
.9435 |
.9439 |
.9438 |
.9428 |
.9291 |
.9374 |
.9317 |
.9174 |
|
ecoli3 |
.8338 |
.8338 |
.8387 |
.7442 |
.8108 |
.7867 |
.8200 |
.8365 |
|
yeast3 |
.8783 |
.8790 |
.8939 |
.8843 |
.8994 |
.8867 |
.9034 |
.8996 |
|
glass6 |
.8868 |
.8868 |
.8255 |
.8662 |
.8596 |
.8596 |
.8454 |
.8019 |
|
segment0 |
.9891 |
.9891 |
.9878 |
.9944 |
.9919 |
.9924 |
.9880 |
.9921 |
|
ecoli2 |
.8452 |
.8577 |
.8797 |
.8809 |
.8599 |
.9024 |
.8949 |
.8785 |
|
new-thyroid1 |
.9741 |
.9741 |
.9713 |
.9741 |
.9624 |
.9624 |
.9651 |
.9624 |
|
new-thyroid2 |
.9473 |
.9445 |
.9449 |
.9677 |
.9888 |
.9888 |
.9647 |
.9916 |
|
ecoli1 |
.9222 |
.9031 |
.8923 |
.9125 |
.8837 |
.8837 |
.8838 |
.9111 |
|
vehicle0 |
.9294 |
.9302 |
.9247 |
.9139 |
.9243 |
.9163 |
.9102 |
.9018 |
|
glass-0-1-2-3_vs_4-5-6 |
.8898 |
.8898 |
.8688 |
.8668 |
.9085 |
.8825 |
.8887 |
.8922 |
|
haberman |
.6189 |
.6085 |
.6381 |
.6074 |
.5368 |
.5368 |
.5368 |
.5368 |
|
vehicle1 |
.7227 |
.7033 |
.7367 |
.6838 |
.7526 |
.7501 |
.7239 |
.7156 |
|
vehicle2 |
.9649 |
.9649 |
.9695 |
.9486 |
.9508 |
.9464 |
.9262 |
.9398 |
|
vehicle3 |
.7297 |
.7292 |
.7183 |
.7085 |
.7454 |
.7542 |
.7514 |
.7477 |
|
yeast1 |
.7012 |
.6972 |
.6881 |
.7135 |
.6988 |
.6983 |
.7086 |
.7199 |
|
glass0 |
.7617 |
.7617 |
.7617 |
.7726 |
.7913 |
.7913 |
.7906 |
.7916 |
|
iris0 |
.9897 |
.9897 |
.9897 |
.9897 |
.9897 |
.9897 |
.9897 |
.9897 |
|
pima |
.7174 |
.7145 |
.6840 |
.7128 |
.7025 |
.7028 |
.7268 |
.6980 |
|
ecoli-0_vs_1 |
.9760 |
.9760 |
.9760 |
.9725 |
.9831 |
.9831 |
.9831 |
.9831 |
|
wisconsin |
.9436 |
.9436 |
.9434 |
.9454 |
.9362 |
.9662 |
.9552 |
.9393 |
|
glass1 |
.7002 |
.7002 |
.7158 |
.7480 |
.6885 |
.6885 |
.6811 |
.6902 |
|
Mean |
.8132 |
.8121 |
.8129 |
.8068 |
.7948 |
.7850 |
.7886 |
.7851 |
|
Median |
.8452 |
.8577 |
.8468 |
.8662 |
.8428 |
.7913 |
.8343 |
.8142 |
This table can be downloaded as an Excel document or as a CSV file
by clicking on the following links ![]() and
and ![]() .
.
Table 6. p-values adjusted with the Bergman-Hommel post-hoc procedure for the C4.5-based and CHAID*-based algorithms for the Kappa and GM measures
|
|
BFPART_C45 |
C4.5 |
PART_C45 |
PART_CHD |
BFPART_CHD |
UnPART_CHD |
CHAID* |
|
UnPART_C45 |
1 |
1 |
.7081598 |
.0007771 |
.0001318 |
.0001198 |
.0000982 |
|
BFPART_C45 |
1 |
1 |
.0043687 |
.0007936 |
.0007771 |
.0007018 |
|
|
C4.5 |
1 |
.0773584 |
.0173961 |
.0173961 |
.0173961 |
||
|
PART_C45 |
.2244410 |
.0773584 |
.0773584 |
.0773584 |
|||
|
PART_CHD |
1 |
1 |
1 |
||||
|
BFPART_CHD |
1 |
1 |
|||||
|
UnPART_CHD |
|
|
|
|
|
|
1 |
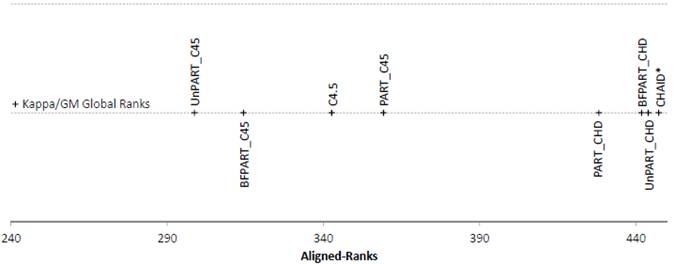
Figure 1. Friedman Aligned Ranks for the C4.5-based and CHAID*-based algorithms for the Kappa and GM measures
2.2 Results for the AUC measure
Table 7. AUC values for the C4.5-based and CHAID*-based algorithms for each of the 30 standard datasets
|
|
C4.5-based |
CHAID*-based |
||||||
|
UnPART |
BFPART |
PART |
C4.5 |
UnPART |
BFPART |
PART |
CHAID* |
|
|
lymphography |
.8402 |
.8192 |
.7544 |
.8193 |
.8369 |
.8363 |
.8459 |
.8163 |
|
ecoli |
.9048 |
.8818 |
.8980 |
.8780 |
.9099 |
.9132 |
.9036 |
.9125 |
|
car |
.9870 |
.9870 |
.9858 |
.9681 |
.9843 |
.9844 |
.9898 |
.9914 |
|
nursery |
.9678 |
.9709 |
.9723 |
.9610 |
.9736 |
.9741 |
.9828 |
.9781 |
|
cleveland |
.7082 |
.6549 |
.6695 |
.6604 |
.7346 |
.7225 |
.7614 |
.7161 |
|
zoo |
.9804 |
.9804 |
.9804 |
.9814 |
.9860 |
.9860 |
.9860 |
.9869 |
|
glass |
.7832 |
.7922 |
.8201 |
.8230 |
.8009 |
.8009 |
.7992 |
.7777 |
|
flare |
.9177 |
.9243 |
.9096 |
.9154 |
.9225 |
.9212 |
.9213 |
.9251 |
|
abalone |
.5820 |
.5878 |
.5525 |
.5668 |
.6824 |
.6823 |
.6878 |
.6847 |
|
balance |
.8616 |
.8616 |
.8953 |
.8359 |
.8466 |
.8606 |
.8604 |
.8328 |
|
dermatology |
.9667 |
.9667 |
.9667 |
.9572 |
.9839 |
.9762 |
.9751 |
.9707 |
|
hepatitis |
.6860 |
.6860 |
.7744 |
.4690 |
.6001 |
.5858 |
.6735 |
.6103 |
|
newthyroid |
.9318 |
.9318 |
.9300 |
.9331 |
.9177 |
.9177 |
.9177 |
.9290 |
|
haberman |
.5700 |
.5700 |
.5883 |
.5714 |
.5117 |
.5117 |
.5390 |
.5171 |
|
breast |
.6299 |
.6299 |
.6096 |
.6016 |
.6709 |
.6709 |
.6487 |
.6712 |
|
german |
.7028 |
.7149 |
.6961 |
.6643 |
.7094 |
.7091 |
.7179 |
.6815 |
|
wisconsin |
.9540 |
.9540 |
.9587 |
.9323 |
.9381 |
.9614 |
.9623 |
.9370 |
|
contraceptive |
.6896 |
.6894 |
.6485 |
.6683 |
.6896 |
.6878 |
.7100 |
.6935 |
|
tictactoe |
.9397 |
.9313 |
.9722 |
.9002 |
.8952 |
.8991 |
.9352 |
.9275 |
|
pima |
.7574 |
.7574 |
.7688 |
.7529 |
.7444 |
.7501 |
.7751 |
.7550 |
|
magic |
.8165 |
.8149 |
.8113 |
.7655 |
.8003 |
.7974 |
.7956 |
.7999 |
|
wine |
.9469 |
.9469 |
.9522 |
.9609 |
.9473 |
.9473 |
.9442 |
.9381 |
|
bupa |
.6709 |
.6418 |
.6536 |
.6897 |
.6502 |
.6502 |
.6345 |
.6567 |
|
heart |
.7651 |
.7706 |
.7894 |
.8021 |
.8166 |
.8381 |
.8395 |
.8019 |
|
australian |
.8762 |
.8548 |
.8400 |
.8578 |
.8646 |
.8925 |
.9033 |
.8745 |
|
crx |
.9059 |
.8964 |
.8772 |
.8664 |
.8739 |
.8821 |
.8969 |
.8781 |
|
vehicle |
.8833 |
.8751 |
.8789 |
.8462 |
.8752 |
.8704 |
.8798 |
.8761 |
|
penbased |
.9448 |
.9487 |
.9458 |
.9523 |
.9476 |
.9426 |
.9481 |
.9436 |
|
ring |
.8990 |
.8990 |
.8739 |
.8489 |
.8742 |
.8714 |
.8714 |
.8776 |
|
iris |
.9640 |
.9640 |
.9687 |
.9538 |
.9683 |
.9683 |
.9683 |
.9577 |
|
Mean |
.8345 |
.8301 |
.8314 |
.8134 |
.8319 |
.8337 |
.8425 |
.8306 |
|
Median |
.8797 |
.8684 |
.8755 |
.8475 |
.8693 |
.8709 |
.8756 |
.8753 |
This table can be downloaded as an Excel document or as a CSV file
by clicking on the following links ![]() and
and ![]() .
.
Table 8. AUC values for the C4.5-based and CHAID*-based algorithms for each of the 33 imbalanced datasets
|
|
C4.5-based |
CHAID*-based |
||||||
|
UnPART |
BFPART |
PART |
C4.5 |
UnPART |
BFPART |
PART |
CHAID* |
|
|
abalone19 |
.5000 |
.5000 |
.5000 |
.5000 |
.5000 |
.5000 |
.5001 |
.5000 |
|
yeast6 |
.7846 |
.7846 |
.8542 |
.7855 |
.5798 |
.5798 |
.6040 |
.5798 |
|
yeast5 |
.9692 |
.9694 |
.9469 |
.9584 |
.8248 |
.8237 |
.8782 |
.8242 |
|
yeast4 |
.7583 |
.7583 |
.8651 |
.7799 |
.7381 |
.7381 |
.8107 |
.7381 |
|
yeast-2_vs_8 |
.6239 |
.5818 |
.6057 |
.5718 |
.7728 |
.7728 |
.7704 |
.7720 |
|
glass5 |
.9927 |
.9927 |
.9927 |
.9951 |
.9878 |
.9878 |
.9878 |
.9878 |
|
abalone9-18 |
.6831 |
.7312 |
.7218 |
.6547 |
.6384 |
.6384 |
.6847 |
.6371 |
|
glass4 |
.6517 |
.6517 |
.6517 |
.6925 |
.6046 |
.6046 |
.6046 |
.5988 |
|
ecoli4 |
.7659 |
.7659 |
.8401 |
.7643 |
.8187 |
.8187 |
.8866 |
.8655 |
|
glass2 |
.7724 |
.7724 |
.7780 |
.7535 |
.4975 |
.4975 |
.4975 |
.4975 |
|
vowel0 |
.9449 |
.9405 |
.9393 |
.9706 |
.8970 |
.9464 |
.9320 |
.8865 |
|
page-blocks0 |
.9765 |
.9764 |
.9604 |
.9595 |
.9624 |
.9647 |
.9654 |
.9552 |
|
ecoli3 |
.7726 |
.7726 |
.8412 |
.7638 |
.9071 |
.9071 |
.9071 |
.9014 |
|
yeast3 |
.9132 |
.9132 |
.9388 |
.9054 |
.9144 |
.9144 |
.9081 |
.9088 |
|
glass6 |
.7914 |
.7914 |
.8171 |
.7914 |
.7895 |
.7895 |
.7895 |
.7873 |
|
segment0 |
.9860 |
.9860 |
.9901 |
.9844 |
.9774 |
.9776 |
.9904 |
.9832 |
|
ecoli2 |
.8296 |
.8296 |
.8296 |
.8459 |
.8288 |
.8288 |
.7824 |
.7966 |
|
new-thyroid1 |
.9548 |
.9548 |
.9548 |
.9655 |
.9544 |
.9544 |
.9544 |
.9516 |
|
new-thyroid2 |
.9349 |
.9349 |
.9349 |
.9472 |
.9345 |
.9345 |
.9345 |
.9373 |
|
ecoli1 |
.9131 |
.9159 |
.9347 |
.8807 |
.9356 |
.9356 |
.9356 |
.9223 |
|
vehicle0 |
.9297 |
.9544 |
.9477 |
.9468 |
.9460 |
.9483 |
.9352 |
.9490 |
|
glass-0-1-2-3_vs_4-5-6 |
.9005 |
.9005 |
.8894 |
.9209 |
.9564 |
.9564 |
.9583 |
.9284 |
|
haberman |
.5700 |
.5700 |
.5883 |
.5714 |
.5117 |
.5117 |
.5390 |
.5117 |
|
vehicle1 |
.6864 |
.7123 |
.7383 |
.7099 |
.6718 |
.6786 |
.7085 |
.6751 |
|
vehicle2 |
.9448 |
.9489 |
.9448 |
.9398 |
.9632 |
.9584 |
.9530 |
.9564 |
|
vehicle3 |
.7628 |
.7666 |
.8012 |
.7357 |
.7455 |
.7516 |
.7857 |
.7788 |
|
yeast1 |
.7083 |
.7134 |
.7425 |
.7017 |
.6768 |
.6746 |
.7036 |
.7007 |
|
glass0 |
.7780 |
.7834 |
.8231 |
.8119 |
.7992 |
.7992 |
.7789 |
.8004 |
|
iris0 |
.9900 |
.9900 |
.9900 |
.9900 |
.9900 |
.9900 |
.9900 |
.9900 |
|
pima |
.7604 |
.7574 |
.7688 |
.7529 |
.7462 |
.7501 |
.7751 |
.7550 |
|
ecoli-0_vs_1 |
.9832 |
.9832 |
.9726 |
.9832 |
.9832 |
.9832 |
.9832 |
.9832 |
|
wisconsin |
.9647 |
.9651 |
.9666 |
.9700 |
.9593 |
.9606 |
.9571 |
.9632 |
|
glass1 |
.7112 |
.7170 |
.6984 |
.7192 |
.6977 |
.6831 |
.6831 |
.6882 |
|
Mean |
.8245 |
.8268 |
.8415 |
.8250 |
.8094 |
.8109 |
.8205 |
.8094 |
|
Median |
.7914 |
.7914 |
.8542 |
.8119 |
.8248 |
.8237 |
.8782 |
.8242 |
This table can be downloaded as an Excel document or as a CSV file
by clicking on the following links ![]() and
and ![]() .
.
Table 9. AUC values for the C4.5-based and CHAID*-based algorithms for each of the 33 SMOTE-preprocessed imbalanced datasets
|
|
C4.5-based |
CHAID*-based |
||||||
|
UnPART |
BFPART |
PART |
C4.5 |
UnPART |
BFPART |
PART |
CHAID* |
|
|
abalone19 |
.5640 |
.6000 |
.5299 |
.5363 |
.5778 |
.6585 |
.5965 |
.6054 |
|
yeast6 |
.8677 |
.8677 |
.8561 |
.8490 |
.8023 |
.7879 |
.8001 |
.7078 |
|
yeast5 |
.9633 |
.9633 |
.9312 |
.9646 |
.9043 |
.8819 |
.7965 |
.8122 |
|
yeast4 |
.8557 |
.8426 |
.8494 |
.8107 |
.8293 |
.8253 |
.7932 |
.7136 |
|
yeast-2_vs_8 |
.7756 |
.7761 |
.8423 |
.7259 |
.7326 |
.7249 |
.7454 |
.6726 |
|
glass5 |
.9415 |
.9415 |
.9415 |
.8890 |
.9220 |
.8646 |
.8829 |
.9402 |
|
abalone9-18 |
.7274 |
.7436 |
.6611 |
.6579 |
.6308 |
.6973 |
.7252 |
.5543 |
|
glass4 |
.8583 |
.8583 |
.8583 |
.8621 |
.7173 |
.7490 |
.7490 |
.6848 |
|
ecoli4 |
.8485 |
.8485 |
.8874 |
.7783 |
.8425 |
.8270 |
.9111 |
.8021 |
|
glass2 |
.7360 |
.7360 |
.7703 |
.7325 |
.6801 |
.6288 |
.6349 |
.7195 |
|
vowel0 |
.9395 |
.9439 |
.9046 |
.9523 |
.8859 |
.8751 |
.8830 |
.8582 |
|
page-blocks0 |
.9727 |
.9759 |
.9697 |
.9582 |
.9678 |
.9731 |
.9682 |
.9549 |
|
ecoli3 |
.8929 |
.8929 |
.8793 |
.7989 |
.8874 |
.8696 |
.8722 |
.8635 |
|
yeast3 |
.9345 |
.9348 |
.9340 |
.9158 |
.9387 |
.9277 |
.9478 |
.9290 |
|
glass6 |
.8323 |
.8323 |
.8073 |
.8908 |
.8386 |
.8386 |
.8759 |
.7245 |
|
segment0 |
.9883 |
.9883 |
.9895 |
.9941 |
.9917 |
.9916 |
.9892 |
.9954 |
|
ecoli2 |
.8906 |
.8834 |
.8957 |
.8768 |
.8447 |
.8855 |
.8979 |
.8909 |
|
new-thyroid1 |
.9802 |
.9802 |
.9718 |
.9802 |
.9603 |
.9603 |
.9659 |
.9615 |
|
new-thyroid2 |
.9516 |
.9536 |
.9460 |
.9714 |
.9865 |
.9865 |
.9794 |
.9921 |
|
ecoli1 |
.9235 |
.9028 |
.9133 |
.9261 |
.9160 |
.9129 |
.9258 |
.9282 |
|
vehicle0 |
.9459 |
.9448 |
.9355 |
.9320 |
.9469 |
.9329 |
.9363 |
.9303 |
|
glass-0-1-2-3_vs_4-5-6 |
.8971 |
.8971 |
.8714 |
.8953 |
.9261 |
.8766 |
.9027 |
.9223 |
|
haberman |
.6243 |
.6510 |
.6518 |
.6262 |
.6031 |
.6031 |
.5992 |
.6081 |
|
vehicle1 |
.7638 |
.7335 |
.7814 |
.6967 |
.7836 |
.7826 |
.7650 |
.7536 |
|
vehicle2 |
.9623 |
.9666 |
.9708 |
.9600 |
.9608 |
.9524 |
.9556 |
.9525 |
|
vehicle3 |
.7807 |
.7858 |
.7708 |
.7378 |
.7720 |
.7820 |
.7924 |
.7837 |
|
yeast1 |
.7507 |
.7550 |
.7523 |
.7362 |
.7160 |
.7210 |
.7487 |
.7607 |
|
glass0 |
.7673 |
.7686 |
.7686 |
.7716 |
.7802 |
.7802 |
.7858 |
.8134 |
|
iris0 |
.9900 |
.9900 |
.9900 |
.9900 |
.9900 |
.9900 |
.9900 |
.9900 |
|
pima |
.7686 |
.7618 |
.7511 |
.7374 |
.7431 |
.7464 |
.7760 |
.7514 |
|
ecoli-0_vs_1 |
.9762 |
.9762 |
.9762 |
.9728 |
.9832 |
.9832 |
.9832 |
.9832 |
|
wisconsin |
.9725 |
.9725 |
.9738 |
.9706 |
.9527 |
.9760 |
.9682 |
.9488 |
|
glass1 |
.7175 |
.7175 |
.7490 |
.7717 |
.7005 |
.7005 |
.7058 |
.7170 |
|
Mean |
.8594 |
.8602 |
.8570 |
.8445 |
.8398 |
.8392 |
.8439 |
.8250 |
|
Median |
.8906 |
.8834 |
.8793 |
.8768 |
.8447 |
.8646 |
.8759 |
.8134 |
This table can be downloaded as an Excel document or as a CSV file
by clicking on the following links ![]() and
and ![]() .
.
Table 10. p-values adjusted with the Bergman-Hommel post-hoc procedure for the C4.5-based and CHAID*-based algorithms for the AUC measure
|
|
UnPART_C45 |
BFPART_C45 |
PART_CHD |
BFPART_CHD |
UnPART_CHD |
C4.5 |
CHAID* |
|
PART_C45 |
1 |
1 |
1 |
.0275614 |
.0150307 |
.0147886 |
.0046853 |
|
UnPART_C45 |
1 |
1 |
.0349476 |
.0150307 |
.0150307 |
.0051593 |
|
|
BFPART_C45 |
1 |
.0349476 |
.0173031 |
.0173031 |
.0064811 |
||
|
PART_CHD |
.1460833 |
.0778909 |
.0778909 |
.0349476 |
|||
|
BFPART_CHD |
1 |
1 |
1 |
||||
|
UnPART_CHD |
1 |
1 |
|||||
|
C4.5 |
|
|
|
|
|
|
1 |
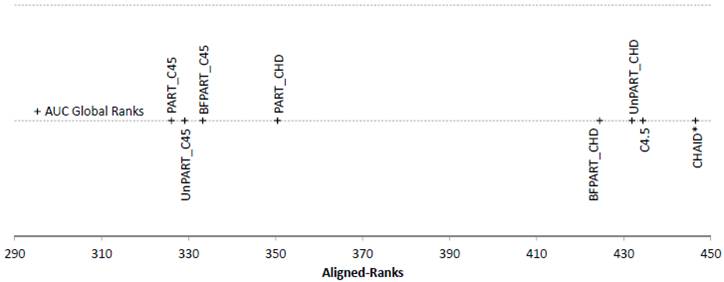
Figure 2. Friedman Aligned Ranks for the C4.5-based and CHAID*-based algorithms for the AUC measure
2.3
Results for the Length measure
Table 11. Length values for the C4.5-based and CHAID*-based algorithms for each of the 30 standard datasets
|
|
C4.5-based |
CHAID*-based |
||||||
|
UnPART |
BFPART |
PART |
C4.5 |
UnPART |
BFPART |
PART |
CHAID* |
|
|
lymphography |
2.10 |
2.05 |
2.34 |
3.68 |
2.30 |
2.52 |
2.46 |
2.99 |
|
ecoli |
2.84 |
2.57 |
2.46 |
5.36 |
4.02 |
4.11 |
4.56 |
4.69 |
|
car |
2.36 |
2.38 |
2.30 |
4.62 |
2.31 |
2.35 |
2.98 |
5.17 |
|
nursery |
1.93 |
2.04 |
2.27 |
4.10 |
2.19 |
2.18 |
3.23 |
4.35 |
|
cleveland |
4.03 |
3.94 |
3.77 |
6.61 |
2.06 |
2.00 |
2.75 |
3.50 |
|
zoo |
1.55 |
1.55 |
1.25 |
3.76 |
1.77 |
1.76 |
1.76 |
2.51 |
|
glass |
2.97 |
3.02 |
2.78 |
5.55 |
2.93 |
2.93 |
3.10 |
3.88 |
|
flare |
1.64 |
1.57 |
2.68 |
3.33 |
1.36 |
2.61 |
3.06 |
1.77 |
|
abalone |
4.83 |
5.03 |
3.98 |
7.67 |
3.62 |
4.03 |
4.30 |
5.02 |
|
balance |
2.18 |
2.18 |
2.98 |
6.06 |
1.89 |
2.04 |
2.69 |
4.00 |
|
dermatology |
2.38 |
2.38 |
2.38 |
3.90 |
2.59 |
3.09 |
3.43 |
4.71 |
|
hepatitis |
1.28 |
1.28 |
1.45 |
2.48 |
.99 |
1.09 |
1.25 |
1.88 |
|
newthyroid |
1.58 |
1.62 |
1.69 |
3.42 |
2.00 |
2.16 |
2.16 |
3.17 |
|
haberman |
.63 |
.63 |
1.23 |
1.26 |
.20 |
.20 |
.30 |
.43 |
|
breast |
.80 |
.80 |
1.94 |
2.11 |
.79 |
.79 |
1.25 |
2.24 |
|
german |
2.48 |
2.30 |
2.68 |
5.27 |
1.41 |
1.39 |
2.46 |
3.56 |
|
wisconsin |
.93 |
.93 |
.98 |
1.78 |
.99 |
1.30 |
2.00 |
1.93 |
|
contraceptive |
6.06 |
4.88 |
5.14 |
10.14 |
2.80 |
2.98 |
3.63 |
4.57 |
|
tictactoe |
2.31 |
2.30 |
2.70 |
4.49 |
2.13 |
2.13 |
2.82 |
4.94 |
|
pima |
1.90 |
1.90 |
1.93 |
5.55 |
1.65 |
1.63 |
2.05 |
3.15 |
|
magic |
2.32 |
2.31 |
2.68 |
6.94 |
2.32 |
2.48 |
3.61 |
3.60 |
|
wine |
1.29 |
1.29 |
1.14 |
2.45 |
2.05 |
2.05 |
2.25 |
3.13 |
|
bupa |
2.00 |
2.18 |
2.22 |
5.74 |
.93 |
.93 |
1.42 |
2.16 |
|
heart |
1.56 |
1.59 |
2.48 |
3.74 |
1.26 |
1.34 |
2.02 |
3.17 |
|
australian |
2.09 |
2.24 |
3.47 |
6.27 |
1.05 |
1.89 |
2.65 |
2.20 |
|
crx |
1.58 |
1.53 |
2.41 |
4.54 |
1.07 |
1.61 |
2.71 |
2.36 |
|
vehicle |
4.45 |
4.42 |
3.47 |
7.62 |
3.88 |
4.02 |
4.61 |
6.19 |
|
penbased |
3.82 |
3.84 |
3.31 |
6.86 |
6.44 |
6.50 |
6.90 |
7.39 |
|
ring |
3.58 |
3.58 |
2.61 |
8.64 |
7.02 |
8.14 |
8.14 |
7.95 |
|
iris |
.95 |
.95 |
.92 |
2.35 |
1.02 |
1.20 |
1.20 |
2.36 |
|
Mean |
2.35 |
2.31 |
2.46 |
4.88 |
2.23 |
2.45 |
2.93 |
3.63 |
|
Median |
2.10 |
2.18 |
2.44 |
4.58 |
2.03 |
2.09 |
2.70 |
3.34 |
This table can be downloaded as an Excel document or as a CSV file
by clicking on the following links ![]() and
and ![]() .
.
Table 12. Length values for the C4.5-based and CHAID*-based algorithms for each of the 33 imbalanced datasets
|
|
C4.5-based |
CHAID*-based |
||||||
|
UnPART |
BFPART |
PART |
C4.5 |
UnPART |
BFPART |
PART |
CHAID* |
|
|
abalone19 |
.00 |
.00 |
.00 |
.00 |
.00 |
.00 |
.30 |
.00 |
|
yeast6 |
.89 |
.89 |
1.17 |
2.77 |
.15 |
.15 |
.28 |
.45 |
|
yeast5 |
1.17 |
1.25 |
1.39 |
4.65 |
.95 |
1.00 |
1.20 |
2.50 |
|
yeast4 |
1.13 |
1.13 |
1.71 |
3.81 |
.68 |
.68 |
1.14 |
1.90 |
|
yeast-2_vs_8 |
.20 |
.60 |
.73 |
.65 |
.90 |
.90 |
1.17 |
1.53 |
|
glass5 |
.75 |
.75 |
.75 |
2.25 |
.67 |
.67 |
.67 |
1.67 |
|
abalone9-18 |
1.09 |
1.07 |
1.62 |
3.06 |
.83 |
.83 |
1.17 |
1.50 |
|
glass4 |
1.17 |
1.17 |
1.17 |
2.73 |
.80 |
.80 |
.80 |
1.69 |
|
ecoli4 |
.87 |
.87 |
1.17 |
1.93 |
.97 |
1.02 |
1.73 |
2.11 |
|
glass2 |
1.18 |
1.18 |
1.34 |
3.51 |
.10 |
.10 |
.10 |
.20 |
|
vowel0 |
1.48 |
1.59 |
1.39 |
3.20 |
2.50 |
2.75 |
2.71 |
4.29 |
|
page-blocks0 |
3.49 |
3.58 |
3.40 |
6.68 |
3.61 |
4.17 |
5.60 |
5.86 |
|
ecoli3 |
1.00 |
1.00 |
1.05 |
2.96 |
.73 |
.73 |
.73 |
1.73 |
|
yeast3 |
1.50 |
1.50 |
2.04 |
4.39 |
.93 |
1.00 |
1.48 |
2.12 |
|
glass6 |
.80 |
.80 |
1.07 |
1.81 |
.87 |
.87 |
.87 |
1.92 |
|
segment0 |
1.72 |
1.72 |
1.72 |
3.70 |
1.55 |
1.59 |
2.40 |
4.06 |
|
ecoli2 |
1.35 |
1.35 |
1.36 |
3.56 |
1.20 |
1.20 |
1.90 |
2.69 |
|
new-thyroid1 |
1.27 |
1.27 |
1.27 |
2.80 |
1.02 |
1.02 |
1.02 |
2.37 |
|
new-thyroid2 |
.97 |
1.04 |
1.04 |
2.23 |
.93 |
.93 |
.93 |
2.25 |
|
ecoli1 |
1.06 |
1.09 |
1.37 |
3.31 |
1.33 |
1.33 |
1.47 |
2.32 |
|
vehicle0 |
2.21 |
2.39 |
2.31 |
6.83 |
2.33 |
2.33 |
2.76 |
4.87 |
|
glass-0-1-2-3_vs_4-5-6 |
1.23 |
1.23 |
1.52 |
2.80 |
1.36 |
1.35 |
1.47 |
2.37 |
|
haberman |
.63 |
.63 |
1.23 |
1.26 |
.20 |
.20 |
.30 |
.40 |
|
vehicle1 |
3.20 |
4.01 |
3.05 |
6.93 |
1.16 |
1.24 |
2.06 |
2.64 |
|
vehicle2 |
2.05 |
2.26 |
2.22 |
5.00 |
2.49 |
2.49 |
2.99 |
4.45 |
|
vehicle3 |
4.05 |
4.06 |
2.64 |
8.34 |
1.76 |
1.92 |
2.76 |
3.22 |
|
yeast1 |
2.18 |
2.09 |
2.52 |
6.29 |
1.52 |
1.60 |
2.50 |
2.90 |
|
glass0 |
1.75 |
1.85 |
1.74 |
4.06 |
1.01 |
1.01 |
1.31 |
2.03 |
|
iris0 |
.50 |
.50 |
.50 |
1.00 |
.50 |
.50 |
.50 |
1.00 |
|
pima |
1.95 |
1.90 |
1.93 |
5.55 |
1.66 |
1.63 |
2.05 |
3.15 |
|
ecoli-0_vs_1 |
.50 |
.50 |
.70 |
1.00 |
.50 |
.50 |
1.00 |
1.00 |
|
wisconsin |
1.03 |
1.05 |
1.07 |
1.62 |
1.28 |
1.40 |
1.97 |
2.79 |
|
glass1 |
1.90 |
1.91 |
2.10 |
4.26 |
1.13 |
1.20 |
1.20 |
2.37 |
|
Mean |
1.40 |
1.46 |
1.52 |
3.48 |
1.14 |
1.19 |
1.53 |
2.31 |
|
Median |
1.17 |
1.18 |
1.37 |
3.20 |
.97 |
1.01 |
1.20 |
2.25 |
This table can be downloaded as an Excel document or as a CSV file
by clicking on the following links ![]() and
and ![]() .
.
Table 13. Length values for the C4.5-based and CHAID*-based algorithms for each of the 33 SMOTE-preprocessed imbalanced datasets
|
|
C4.5-based |
CHAID*-based |
||||||
|
UnPART |
BFPART |
PART |
C4.5 |
UnPART |
BFPART |
PART |
CHAID* |
|
|
abalone19 |
4.92 |
4.29 |
3.63 |
9.73 |
5.40 |
6.40 |
7.52 |
9.78 |
|
yeast6 |
2.80 |
2.89 |
2.55 |
5.69 |
4.34 |
4.71 |
6.25 |
6.98 |
|
yeast5 |
1.93 |
1.95 |
1.97 |
4.77 |
2.99 |
4.22 |
4.30 |
4.99 |
|
yeast4 |
3.97 |
4.20 |
3.21 |
7.42 |
4.83 |
4.92 |
5.04 |
7.58 |
|
yeast-2_vs_8 |
2.09 |
2.17 |
2.09 |
5.80 |
2.76 |
2.81 |
3.24 |
5.45 |
|
glass5 |
1.90 |
1.90 |
1.70 |
3.40 |
2.24 |
2.34 |
2.64 |
3.79 |
|
abalone9-18 |
3.54 |
3.84 |
2.88 |
7.48 |
2.97 |
3.05 |
3.52 |
5.71 |
|
glass4 |
1.83 |
1.83 |
1.83 |
3.99 |
2.08 |
2.75 |
2.80 |
3.26 |
|
ecoli4 |
1.61 |
1.61 |
1.65 |
4.10 |
1.85 |
2.18 |
2.17 |
3.58 |
|
glass2 |
2.29 |
2.29 |
2.46 |
6.68 |
2.54 |
2.60 |
2.93 |
4.53 |
|
vowel0 |
2.10 |
2.23 |
2.16 |
4.00 |
3.34 |
3.63 |
3.93 |
4.45 |
|
page-blocks0 |
5.08 |
5.04 |
3.76 |
9.40 |
5.03 |
5.36 |
6.25 |
8.01 |
|
ecoli3 |
1.80 |
1.80 |
1.86 |
5.04 |
2.20 |
2.33 |
2.05 |
3.86 |
|
yeast3 |
3.09 |
3.07 |
2.74 |
6.44 |
2.94 |
3.23 |
3.67 |
5.55 |
|
glass6 |
1.65 |
1.65 |
1.85 |
3.33 |
1.94 |
1.94 |
1.74 |
2.95 |
|
segment0 |
2.07 |
2.04 |
2.01 |
4.32 |
2.19 |
2.40 |
3.19 |
5.20 |
|
ecoli2 |
1.90 |
1.76 |
1.84 |
5.22 |
1.99 |
2.43 |
2.80 |
3.76 |
|
new-thyroid1 |
1.16 |
1.16 |
1.16 |
2.41 |
1.13 |
1.13 |
1.43 |
2.03 |
|
new-thyroid2 |
1.40 |
1.40 |
1.20 |
2.73 |
1.27 |
1.33 |
1.43 |
2.24 |
|
ecoli1 |
1.33 |
1.31 |
1.45 |
3.69 |
1.27 |
1.17 |
1.68 |
2.60 |
|
vehicle0 |
2.81 |
2.88 |
2.55 |
7.21 |
3.13 |
3.26 |
3.92 |
6.14 |
|
glass-0-1-2-3_vs_4-5-6 |
1.47 |
1.47 |
1.55 |
3.57 |
1.94 |
2.02 |
2.05 |
3.61 |
|
haberman |
1.75 |
2.02 |
2.18 |
4.06 |
.68 |
.68 |
.87 |
1.52 |
|
vehicle1 |
5.38 |
5.75 |
3.69 |
8.56 |
2.63 |
2.76 |
3.88 |
5.41 |
|
vehicle2 |
2.49 |
2.49 |
2.71 |
5.11 |
2.83 |
3.10 |
3.85 |
4.81 |
|
vehicle3 |
4.79 |
5.11 |
3.02 |
10.30 |
2.89 |
3.05 |
4.05 |
5.48 |
|
yeast1 |
3.27 |
2.97 |
2.79 |
7.70 |
1.98 |
1.85 |
3.08 |
3.90 |
|
glass0 |
1.96 |
2.11 |
2.11 |
4.59 |
1.60 |
1.60 |
1.90 |
2.72 |
|
iris0 |
.50 |
.50 |
.50 |
1.00 |
.50 |
.50 |
.50 |
1.00 |
|
pima |
2.60 |
2.37 |
2.67 |
6.16 |
1.70 |
1.72 |
1.94 |
3.39 |
|
ecoli-0_vs_1 |
.76 |
.76 |
.76 |
2.33 |
.60 |
.60 |
1.00 |
1.13 |
|
wisconsin |
.98 |
.98 |
1.05 |
1.82 |
1.48 |
1.59 |
2.12 |
2.68 |
|
glass1 |
2.02 |
2.05 |
2.05 |
4.91 |
1.58 |
1.58 |
1.75 |
2.93 |
|
Mean |
2.40 |
2.42 |
2.17 |
5.24 |
2.39 |
2.58 |
3.02 |
4.27 |
|
Median |
2.02 |
2.05 |
2.09 |
4.91 |
2.19 |
2.40 |
2.80 |
3.86 |
This table can be downloaded as an Excel document or as a CSV file by
clicking on the following links ![]() and
and ![]() .
.
Table 14. p-values adjusted with the Bergman-Hommel post-hoc procedure for the C4.5-based and CHAID*-based algorithms for the Length measure
|
|
UnPART_C45 |
BFPART_C45 |
BFPART_CHD |
PART_C45 |
PART_CHD |
CHAID* |
C4.5 |
|
UnPART_CHD |
.7961195 |
.7928757 |
.7928757 |
.3944330 |
4.65E-07 |
0 |
0 |
|
UnPART_C45 |
1 |
1 |
1 |
.0002222 |
0 |
0 |
|
|
BFPART_C45 |
1 |
1 |
.0003191 |
0 |
0 |
||
|
BFPART_CHD |
1 |
.0004252 |
0 |
0 |
|||
|
PART_C45 |
.0039008 |
0 |
0 |
||||
|
PART_CHD |
5.19E-08 |
0 |
|||||
|
CHAID* |
|
|
|
|
|
|
.0467747 |
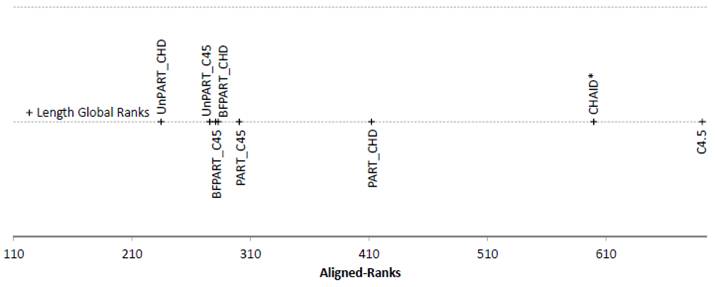
Figure 3. Friedman Aligned Ranks for the C4.5-based and CHAID*-based algorithms for the Length measure
2.4
Results for the Number of Rules by the Length of rules
Table 15. Number of Rules multiplied by Length values for the C4.5-based and CHAID*-based algorithms for each of the 30 standard datasets
|
|
C4.5-based |
CHAID*-based |
||||||
|
UnPART |
BFPART |
PART |
C4.5 |
UnPART |
BFPART |
PART |
CHAID* |
|
|
lymphography |
13.40 |
14.40 |
21.80 |
53.20 |
12.88 |
17.20 |
17.40 |
34.00 |
|
ecoli |
34.80 |
27.00 |
35.20 |
104.20 |
26.40 |
27.80 |
31.00 |
62.08 |
|
car |
90.20 |
92.60 |
121.80 |
527.80 |
54.88 |
56.40 |
83.60 |
249.60 |
|
nursery |
52.00 |
58.00 |
113.80 |
268.80 |
39.60 |
39.80 |
70.20 |
163.80 |
|
cleveland |
77.36 |
75.80 |
129.60 |
244.40 |
7.72 |
8.00 |
14.40 |
33.20 |
|
zoo |
11.20 |
11.20 |
9.00 |
32.80 |
14.84 |
14.80 |
14.40 |
26.60 |
|
glass |
36.40 |
36.40 |
44.80 |
123.00 |
16.80 |
16.80 |
18.20 |
39.32 |
|
flare |
16.00 |
13.60 |
91.00 |
152.60 |
9.92 |
31.40 |
47.40 |
13.80 |
|
abalone |
225.20 |
235.40 |
322.20 |
776.00 |
17.44 |
18.92 |
18.72 |
56.28 |
|
balance |
26.80 |
26.80 |
97.60 |
224.40 |
13.00 |
12.60 |
19.60 |
58.00 |
|
dermatology |
18.00 |
18.00 |
18.00 |
91.40 |
20.96 |
29.00 |
31.60 |
71.80 |
|
hepatitis |
4.40 |
4.40 |
6.20 |
12.00 |
2.36 |
2.56 |
3.16 |
10.08 |
|
newthyroid |
7.00 |
7.20 |
7.40 |
23.40 |
10.00 |
10.80 |
10.80 |
24.80 |
|
haberman |
2.40 |
2.40 |
4.00 |
5.20 |
0.40 |
0.40 |
0.60 |
0.92 |
|
breast |
3.20 |
3.20 |
28.60 |
28.60 |
3.00 |
3.00 |
4.00 |
9.40 |
|
german |
44.40 |
34.60 |
161.00 |
343.80 |
6.80 |
7.80 |
17.00 |
54.00 |
|
wisconsin |
4.80 |
4.80 |
8.40 |
57.40 |
4.80 |
6.80 |
8.40 |
13.00 |
|
contraceptive |
203.00 |
149.80 |
737.60 |
1126.40 |
16.40 |
16.20 |
34.00 |
72.80 |
|
tictactoe |
48.40 |
52.40 |
107.20 |
348.20 |
18.80 |
18.20 |
38.40 |
157.44 |
|
pima |
12.20 |
12.20 |
14.40 |
125.20 |
6.92 |
7.20 |
9.20 |
24.60 |
|
magic |
18.40 |
18.00 |
27.00 |
273.80 |
9.40 |
10.80 |
21.32 |
33.20 |
|
wine |
5.40 |
5.40 |
4.80 |
12.80 |
8.60 |
8.60 |
9.00 |
24.40 |
|
bupa |
17.20 |
18.20 |
15.40 |
148.80 |
3.20 |
3.20 |
4.20 |
9.60 |
|
heart |
11.60 |
13.00 |
41.80 |
81.00 |
5.12 |
5.64 |
10.68 |
29.20 |
|
australian |
25.00 |
26.00 |
93.40 |
130.00 |
5.00 |
10.40 |
14.20 |
13.52 |
|
crx |
11.60 |
11.60 |
79.00 |
91.60 |
4.04 |
7.24 |
15.20 |
14.16 |
|
vehicle |
91.40 |
98.60 |
109.20 |
477.80 |
44.44 |
45.88 |
65.60 |
231.84 |
|
penbased |
91.20 |
90.80 |
96.20 |
343.20 |
145.64 |
145.68 |
163.88 |
453.04 |
|
ring |
25.80 |
25.80 |
29.00 |
217.00 |
14.04 |
16.28 |
16.28 |
121.04 |
|
iris |
3.00 |
3.00 |
4.00 |
10.20 |
3.20 |
3.60 |
3.60 |
10.00 |
|
Mean |
41.06 |
39.69 |
85.98 |
215.17 |
18.22 |
20.10 |
27.20 |
70.52 |
|
Median |
18.20 |
18.10 |
38.50 |
127.60 |
9.96 |
11.70 |
16.64 |
33.20 |
This table can be downloaded as an Excel document or as a CSV file
by clicking on the following links ![]() and
and ![]() .
.
Table 16. Number of Rules multiplied by Length values for the C4.5-based and CHAID*-based algorithms for each of the 33 imbalanced datasets
|
|
C4.5-based |
CHAID*-based |
||||||
|
UnPART |
BFPART |
PART |
C4.5 |
UnPART |
BFPART |
PART |
CHAID* |
|
|
abalone19 |
0.00 |
0.00 |
0.00 |
0.00 |
0.00 |
0.00 |
1.20 |
0.00 |
|
yeast6 |
4.20 |
4.20 |
5.60 |
17.40 |
0.60 |
0.60 |
1.00 |
1.80 |
|
yeast5 |
8.40 |
9.20 |
10.20 |
43.00 |
3.80 |
4.00 |
4.80 |
12.80 |
|
yeast4 |
6.00 |
6.00 |
12.40 |
35.40 |
2.80 |
2.80 |
4.00 |
9.00 |
|
yeast-2_vs_8 |
0.40 |
2.20 |
2.60 |
2.20 |
1.80 |
1.80 |
2.80 |
4.40 |
|
glass5 |
3.00 |
3.00 |
3.00 |
9.00 |
2.00 |
2.00 |
2.00 |
5.00 |
|
abalone9-18 |
5.40 |
5.60 |
13.60 |
27.40 |
2.20 |
2.20 |
3.60 |
4.80 |
|
glass4 |
4.60 |
4.60 |
4.60 |
15.40 |
2.20 |
2.20 |
2.20 |
6.20 |
|
ecoli4 |
2.60 |
2.60 |
4.40 |
7.20 |
3.00 |
3.20 |
5.60 |
9.80 |
|
glass2 |
6.40 |
6.40 |
7.40 |
25.60 |
0.20 |
0.20 |
0.20 |
0.40 |
|
vowel0 |
7.60 |
8.80 |
8.60 |
25.00 |
10.80 |
11.96 |
13.60 |
56.04 |
|
page-blocks0 |
40.40 |
39.00 |
58.60 |
242.80 |
25.84 |
35.60 |
57.76 |
198.36 |
|
ecoli3 |
4.60 |
4.60 |
4.20 |
20.20 |
2.20 |
2.20 |
2.20 |
5.60 |
|
yeast3 |
9.00 |
9.00 |
18.60 |
60.20 |
3.00 |
3.20 |
5.20 |
8.80 |
|
glass6 |
2.40 |
2.40 |
3.60 |
6.40 |
2.60 |
2.60 |
2.60 |
7.00 |
|
segment0 |
10.00 |
10.00 |
10.80 |
36.00 |
8.00 |
8.60 |
16.40 |
33.60 |
|
ecoli2 |
6.00 |
6.00 |
6.60 |
27.00 |
3.80 |
3.80 |
3.80 |
13.00 |
|
new-thyroid1 |
3.80 |
3.80 |
3.80 |
15.20 |
3.80 |
3.80 |
3.80 |
11.40 |
|
new-thyroid2 |
3.40 |
3.60 |
3.60 |
10.40 |
3.60 |
3.60 |
3.60 |
10.60 |
|
ecoli1 |
5.00 |
5.40 |
7.20 |
23.80 |
4.00 |
4.00 |
4.40 |
11.20 |
|
vehicle0 |
22.00 |
24.00 |
28.20 |
137.00 |
16.64 |
17.16 |
23.48 |
84.04 |
|
glass-0-1-2-3_vs_4-5-6 |
5.00 |
5.00 |
7.00 |
16.40 |
4.08 |
4.04 |
4.40 |
12.00 |
|
haberman |
2.40 |
2.40 |
4.00 |
5.20 |
0.40 |
0.40 |
0.60 |
0.80 |
|
vehicle1 |
37.80 |
51.80 |
35.40 |
254.60 |
4.60 |
5.20 |
10.40 |
15.60 |
|
vehicle2 |
15.00 |
20.20 |
19.60 |
79.00 |
16.00 |
17.40 |
23.40 |
68.60 |
|
vehicle3 |
43.80 |
39.80 |
29.80 |
354.20 |
8.40 |
9.20 |
19.00 |
27.80 |
|
yeast1 |
19.40 |
20.20 |
22.00 |
142.80 |
5.88 |
6.16 |
13.60 |
17.60 |
|
glass0 |
9.80 |
9.80 |
12.80 |
41.40 |
2.68 |
2.68 |
2.76 |
7.80 |
|
iris0 |
1.00 |
1.00 |
1.00 |
2.00 |
1.00 |
1.00 |
1.00 |
2.00 |
|
pima |
11.80 |
12.20 |
14.40 |
125.20 |
6.96 |
7.20 |
9.20 |
24.60 |
|
ecoli-0_vs_1 |
1.00 |
1.00 |
2.20 |
2.00 |
1.00 |
1.00 |
2.00 |
2.00 |
|
wisconsin |
7.20 |
7.80 |
9.60 |
55.60 |
7.20 |
8.80 |
9.60 |
32.20 |
|
glass1 |
10.80 |
9.80 |
12.60 |
47.60 |
3.40 |
3.00 |
3.00 |
12.00 |
|
Mean |
9.70 |
10.35 |
11.76 |
57.96 |
4.98 |
5.50 |
7.98 |
21.72 |
|
Median |
6.00 |
6.00 |
7.40 |
25.60 |
3.40 |
3.20 |
3.80 |
10.60 |
This table can be downloaded as an Excel document or as a CSV file by
clicking on the following links ![]() and
and ![]() .
.
Table 17. Number of Rules values multiplied by Length for the C4.5-based and CHAID*-based algorithms for each of the 33 SMOTE-preprocessed imbalanced datasets
|
|
C4.5-based |
CHAID*-based |
||||||
|
UnPART |
BFPART |
PART |
C4.5 |
UnPART |
BFPART |
PART |
CHAID* |
|
|
abalone19 |
112.20 |
103.20 |
125.20 |
658.20 |
101.44 |
127.20 |
154.00 |
737.00 |
|
yeast6 |
28.40 |
29.20 |
27.20 |
125.20 |
43.80 |
51.60 |
75.40 |
256.00 |
|
yeast5 |
13.20 |
13.40 |
15.20 |
55.20 |
28.00 |
40.00 |
53.60 |
59.20 |
|
yeast4 |
61.00 |
61.60 |
58.40 |
307.00 |
66.48 |
69.80 |
74.80 |
345.00 |
|
yeast-2_vs_8 |
15.20 |
15.80 |
16.60 |
75.00 |
20.20 |
21.20 |
28.80 |
81.00 |
|
glass5 |
5.80 |
5.80 |
7.20 |
21.20 |
8.40 |
9.80 |
10.00 |
34.00 |
|
abalone9-18 |
72.80 |
74.80 |
75.00 |
367.00 |
32.40 |
34.16 |
42.32 |
167.80 |
|
glass4 |
8.80 |
8.80 |
8.80 |
35.20 |
7.00 |
9.40 |
9.60 |
26.20 |
|
ecoli4 |
8.20 |
8.20 |
9.00 |
40.60 |
7.60 |
9.00 |
11.60 |
34.00 |
|
glass2 |
17.40 |
17.40 |
20.00 |
108.80 |
8.60 |
9.40 |
13.60 |
45.40 |
|
vowel0 |
13.80 |
15.20 |
13.60 |
49.00 |
29.44 |
34.08 |
42.64 |
58.80 |
|
page-blocks0 |
151.40 |
143.60 |
157.40 |
1097.00 |
96.60 |
110.60 |
210.40 |
710.40 |
|
ecoli3 |
12.80 |
12.80 |
14.60 |
66.20 |
9.20 |
10.20 |
8.20 |
35.80 |
|
yeast3 |
41.00 |
41.40 |
41.60 |
203.80 |
21.20 |
25.80 |
30.40 |
135.60 |
|
glass6 |
7.80 |
7.80 |
7.40 |
29.60 |
6.80 |
6.80 |
7.00 |
19.80 |
|
segment0 |
14.80 |
16.00 |
15.40 |
59.80 |
13.20 |
15.20 |
26.00 |
72.40 |
|
ecoli2 |
14.80 |
14.40 |
16.00 |
83.40 |
10.00 |
12.60 |
11.40 |
32.60 |
|
new-thyroid1 |
4.00 |
4.00 |
4.00 |
11.00 |
3.20 |
3.20 |
4.40 |
8.40 |
|
new-thyroid2 |
5.20 |
5.20 |
4.40 |
17.80 |
3.80 |
4.00 |
5.20 |
10.40 |
|
ecoli1 |
6.80 |
9.00 |
10.00 |
33.40 |
5.40 |
4.80 |
5.80 |
15.60 |
|
vehicle0 |
38.60 |
39.60 |
45.40 |
213.60 |
26.36 |
29.60 |
44.40 |
162.40 |
|
glass-0-1-2-3_vs_4-5-6 |
6.40 |
6.40 |
9.00 |
31.20 |
8.80 |
9.64 |
9.80 |
37.20 |
|
haberman |
9.60 |
11.40 |
11.20 |
44.80 |
1.80 |
1.80 |
2.00 |
4.60 |
|
vehicle1 |
90.00 |
103.80 |
76.40 |
612.20 |
20.28 |
18.68 |
35.40 |
154.88 |
|
vehicle2 |
23.80 |
23.80 |
32.00 |
95.20 |
25.44 |
29.00 |
41.24 |
80.60 |
|
vehicle3 |
85.80 |
88.80 |
83.60 |
788.40 |
23.80 |
26.60 |
46.28 |
146.20 |
|
yeast1 |
45.20 |
42.20 |
49.00 |
440.00 |
7.32 |
8.80 |
21.20 |
46.00 |
|
glass0 |
11.40 |
11.80 |
11.80 |
60.60 |
4.40 |
4.40 |
4.20 |
13.80 |
|
iris0 |
1.00 |
1.00 |
1.00 |
2.00 |
1.00 |
1.00 |
1.00 |
2.00 |
|
pima |
25.60 |
20.80 |
27.20 |
185.00 |
7.84 |
7.64 |
9.32 |
30.20 |
|
ecoli-0_vs_1 |
3.20 |
3.20 |
3.20 |
10.80 |
1.20 |
1.20 |
2.00 |
2.60 |
|
wisconsin |
9.40 |
9.40 |
13.20 |
65.00 |
9.40 |
11.60 |
13.40 |
39.00 |
|
glass1 |
13.00 |
13.20 |
15.00 |
70.00 |
5.72 |
5.72 |
6.60 |
20.00 |
|
Mean |
29.65 |
29.79 |
31.06 |
183.73 |
20.19 |
23.17 |
32.18 |
109.84 |
|
Median |
13.80 |
14.40 |
15.20 |
66.20 |
9.20 |
10.20 |
13.40 |
39.00 |
This table can be downloaded as an Excel document or as a CSV file
by clicking on the following links ![]() and
and ![]() .
.
Table 18. p-values adjusted with the Bergman-Hommel post-hoc procedure for the C4.5-based and CHAID*-based algorithms for the Number of Rules multiplied by Length
|
|
BFPART_CHD |
PART_CHD |
UnPART_C45 |
BFPART_C45 |
PART_C45 |
CHAID* |
C4.5 |
|
UnPART_CHD |
1 |
0.806812 |
0.806812 |
0.806812 |
0.000198 |
0 |
0 |
|
BFPART_CHD |
1 |
1 |
1 |
0.000929 |
0 |
0 |
|
|
PART_CHD |
1 |
1 |
0.026575 |
0.000000 |
0 |
||
|
UnPART_C45 |
1 |
0.030899 |
0.000000 |
0 |
|||
|
BFPART_C45 |
0.063328 |
0.000000 |
0 |
||||
|
PART_C45 |
0.000065 |
0 |
|||||
|
CHAID* |
|
|
|
|
|
|
0.000049 |
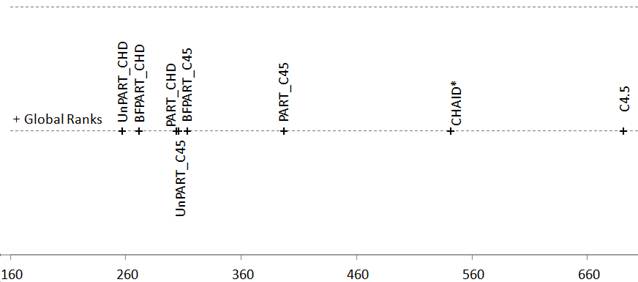
Figure 4. Friedman Aligned Ranks for the C4.5-based and CHAID*-based algorithms for the Number of Rules multiplied by Length
2.5 Results for the Time Measure
Table 19. Time values for the C4.5-based and CHAID*-based algorithms for each of the 30 standard datasets
|
|
C4.5-based |
CHAID*-based |
||||||
|
UnPART |
BFPART |
PART |
C4.5 |
UnPART |
BFPART |
PART |
CHAID* |
|
|
lymphography |
14 |
19 |
16 |
8 |
94 |
99 |
59 |
46 |
|
ecoli |
50 |
40 |
34 |
19 |
208 |
204 |
174 |
91 |
|
car |
145 |
198 |
47 |
18 |
708 |
703 |
330 |
114 |
|
nursery |
107 |
110 |
55 |
14 |
633 |
576 |
226 |
94 |
|
cleveland |
107 |
99 |
82 |
26 |
128 |
143 |
122 |
89 |
|
zoo |
9 |
8 |
8 |
7 |
60 |
99 |
31 |
24 |
|
glass |
70 |
64 |
52 |
21 |
321 |
299 |
265 |
148 |
|
flare |
56 |
51 |
47 |
20 |
175 |
306 |
184 |
84 |
|
abalone |
1867 |
1623 |
1858 |
139 |
794 |
871 |
849 |
575 |
|
balance |
47 |
47 |
27 |
13 |
57 |
58 |
39 |
27 |
|
dermatology |
23 |
18 |
18 |
13 |
381 |
578 |
243 |
117 |
|
hepatitis |
8 |
2 |
7 |
7 |
22 |
18 |
16 |
24 |
|
newthyroid |
11 |
6 |
7 |
7 |
69 |
55 |
47 |
44 |
|
haberman |
4 |
7 |
6 |
5 |
6 |
7 |
7 |
11 |
|
breast |
11 |
9 |
22 |
9 |
42 |
41 |
41 |
25 |
|
german |
204 |
193 |
284 |
51 |
1071 |
1157 |
1173 |
462 |
|
wisconsin |
18 |
14 |
16 |
7 |
160 |
179 |
177 |
77 |
|
contraceptive |
657 |
710 |
314 |
71 |
254 |
249 |
228 |
106 |
|
tictactoe |
89 |
90 |
54 |
15 |
319 |
267 |
129 |
94 |
|
pima |
67 |
59 |
53 |
33 |
555 |
596 |
515 |
338 |
|
magic |
1661 |
1432 |
1914 |
886 |
21053 |
21710 |
25879 |
12293 |
|
wine |
16 |
17 |
16 |
11 |
243 |
175 |
146 |
123 |
|
bupa |
26 |
31 |
16 |
13 |
45 |
47 |
44 |
33 |
|
heart |
21 |
24 |
28 |
13 |
106 |
106 |
137 |
81 |
|
australian |
79 |
74 |
97 |
33 |
417 |
499 |
443 |
260 |
|
crx |
50 |
48 |
128 |
27 |
357 |
432 |
529 |
257 |
|
vehicle |
390 |
370 |
227 |
68 |
3567 |
3162 |
1930 |
847 |
|
penbased |
779 |
693 |
371 |
106 |
13565 |
11505 |
5144 |
1420 |
|
ring |
965 |
821 |
1294 |
586 |
8835 |
8842 |
8526 |
8329 |
|
iris |
10 |
5 |
5 |
6 |
22 |
22 |
17 |
16 |
|
Mean |
252 |
229 |
237 |
75 |
1809 |
1767 |
1588 |
875 |
|
Median |
53 |
49 |
47 |
16 |
248 |
258 |
180 |
94 |
This table can be downloaded as an Excel document or as a CSV file
by clicking on the following links ![]() and
and ![]() .
.
Table 20. Time values for the C4.5-based and CHAID*-based algorithms for each of the 33 imbalanced datasets
|
|
C4.5-based |
CHAID*-based |
||||||
|
UnPART |
BFPART |
PART |
C4.5 |
UnPART |
BFPART |
PART |
CHAID* |
|
|
abalone19 |
343 |
293 |
295 |
287 |
6623 |
6210 |
7475 |
6270 |
|
yeast6 |
18 |
17 |
16 |
11 |
213 |
198 |
194 |
206 |
|
yeast5 |
21 |
19 |
15 |
12 |
273 |
202 |
205 |
212 |
|
yeast4 |
19 |
21 |
20 |
14 |
303 |
277 |
248 |
250 |
|
yeast-2_vs_8 |
5 |
6 |
7 |
7 |
57 |
50 |
59 |
52 |
|
glass5 |
8 |
8 |
8 |
8 |
66 |
42 |
52 |
57 |
|
abalone9-18 |
51 |
46 |
54 |
40 |
731 |
693 |
734 |
608 |
|
glass4 |
11 |
9 |
8 |
11 |
104 |
73 |
73 |
93 |
|
ecoli4 |
8 |
6 |
7 |
8 |
71 |
50 |
62 |
63 |
|
glass2 |
19 |
15 |
15 |
13 |
29 |
26 |
24 |
29 |
|
vowel0 |
179 |
154 |
151 |
139 |
7295 |
5876 |
5529 |
5664 |
|
page-blocks0 |
1058 |
914 |
934 |
596 |
33853 |
33153 |
42501 |
22628 |
|
ecoli3 |
9 |
9 |
9 |
8 |
58 |
45 |
42 |
40 |
|
yeast3 |
28 |
23 |
27 |
16 |
303 |
272 |
301 |
246 |
|
glass6 |
10 |
10 |
10 |
9 |
108 |
87 |
83 |
90 |
|
segment0 |
781 |
663 |
789 |
551 |
19787 |
14595 |
24362 |
12074 |
|
ecoli2 |
10 |
11 |
10 |
7 |
66 |
67 |
54 |
46 |
|
new-thyroid1 |
8 |
7 |
11 |
7 |
35 |
31 |
27 |
26 |
|
new-thyroid2 |
6 |
6 |
6 |
6 |
34 |
20 |
17 |
25 |
|
ecoli1 |
11 |
11 |
10 |
10 |
79 |
84 |
82 |
62 |
|
vehicle0 |
81 |
74 |
51 |
31 |
1201 |
1046 |
900 |
456 |
|
glass-0-1-2-3_vs_4-5-6 |
13 |
12 |
13 |
10 |
125 |
110 |
120 |
90 |
|
haberman |
14 |
6 |
6 |
8 |
11 |
27 |
28 |
11 |
|
vehicle1 |
189 |
223 |
129 |
49 |
709 |
714 |
718 |
420 |
|
vehicle2 |
69 |
76 |
51 |
29 |
1287 |
1040 |
950 |
506 |
|
vehicle3 |
222 |
178 |
108 |
56 |
903 |
828 |
912 |
438 |
|
yeast1 |
63 |
61 |
44 |
30 |
373 |
381 |
508 |
256 |
|
glass0 |
21 |
22 |
18 |
14 |
104 |
120 |
97 |
75 |
|
iris0 |
4 |
3 |
3 |
3 |
9 |
4 |
4 |
11 |
|
pima |
68 |
65 |
55 |
35 |
556 |
575 |
532 |
336 |
|
ecoli-0_vs_1 |
5 |
4 |
5 |
5 |
30 |
24 |
19 |
27 |
|
wisconsin |
18 |
14 |
16 |
8 |
200 |
193 |
173 |
91 |
|
glass1 |
21 |
21 |
18 |
13 |
118 |
100 |
89 |
88 |
|
Mean |
103 |
91 |
88 |
62 |
2294 |
2037 |
2642 |
1562 |
|
Median |
19 |
17 |
16 |
12 |
125 |
120 |
120 |
91 |
This table can be downloaded as an Excel document or as a CSV file
by clicking on the following links ![]() and
and ![]() .
.
Table 21. Time values for the C4.5-based and CHAID*-based algorithms for each of the 33 SMOTE-preprocessed imbalanced datasets
|
|
C4.5-based |
CHAID*-based |
||||||
|
UnPART |
BFPART |
PART |
C4.5 |
UnPART |
BFPART |
PART |
CHAID* |
|
|
abalone19 |
50138 |
38491 |
29208 |
7766 |
1411243 |
1415336 |
1086926 |
252893 |
|
yeast6 |
691 |
587 |
647 |
403 |
45184 |
38775 |
44531 |
13834 |
|
yeast5 |
854 |
731 |
724 |
467 |
41557 |
36696 |
28528 |
12344 |
|
yeast4 |
1473 |
1298 |
782 |
334 |
62353 |
57358 |
49315 |
15453 |
|
yeast-2_vs_8 |
120 |
101 |
77 |
50 |
3902 |
3155 |
3113 |
1296 |
|
glass5 |
33 |
27 |
28 |
34 |
674 |
492 |
556 |
462 |
|
abalone9-18 |
1505 |
1327 |
985 |
220 |
18950 |
17504 |
15040 |
4769 |
|
glass4 |
40 |
33 |
48 |
32 |
756 |
595 |
470 |
419 |
|
ecoli4 |
54 |
45 |
52 |
33 |
924 |
704 |
900 |
552 |
|
glass2 |
93 |
79 |
81 |
50 |
698 |
592 |
910 |
484 |
|
vowel0 |
1210 |
1024 |
907 |
622 |
68271 |
54730 |
44627 |
19085 |
|
page-blocks0 |
13534 |
11673 |
7944 |
2798 |
776982 |
741953 |
763009 |
145189 |
|
ecoli3 |
60 |
48 |
39 |
32 |
676 |
575 |
535 |
422 |
|
yeast3 |
565 |
491 |
587 |
320 |
25298 |
22970 |
21088 |
11619 |
|
glass6 |
32 |
30 |
21 |
28 |
489 |
378 |
304 |
325 |
|
segment0 |
4480 |
3765 |
4726 |
3269 |
148637 |
115337 |
170759 |
96426 |
|
ecoli2 |
45 |
41 |
39 |
33 |
674 |
597 |
562 |
423 |
|
new-thyroid1 |
10 |
10 |
9 |
15 |
140 |
107 |
110 |
119 |
|
new-thyroid2 |
13 |
10 |
12 |
15 |
172 |
120 |
112 |
121 |
|
ecoli1 |
25 |
30 |
26 |
25 |
361 |
332 |
308 |
254 |
|
vehicle0 |
164 |
164 |
99 |
54 |
2694 |
2300 |
1818 |
991 |
|
glass-0-1-2-3_vs_4-5-6 |
22 |
22 |
21 |
23 |
475 |
389 |
354 |
292 |
|
haberman |
12 |
19 |
7 |
17 |
15 |
13 |
18 |
23 |
|
vehicle1 |
551 |
535 |
256 |
93 |
2301 |
2113 |
2155 |
957 |
|
vehicle2 |
116 |
105 |
84 |
52 |
2772 |
2258 |
1823 |
853 |
|
vehicle3 |
557 |
547 |
264 |
102 |
2538 |
2513 |
2525 |
956 |
|
yeast1 |
402 |
367 |
446 |
158 |
5653 |
6328 |
7564 |
3550 |
|
glass0 |
33 |
30 |
25 |
28 |
250 |
222 |
201 |
192 |
|
iris0 |
4 |
2 |
4 |
11 |
17 |
9 |
9 |
21 |
|
pima |
152 |
135 |
121 |
63 |
1303 |
1269 |
1048 |
654 |
|
ecoli-0_vs_1 |
8 |
5 |
7 |
12 |
67 |
31 |
31 |
52 |
|
wisconsin |
22 |
27 |
23 |
15 |
313 |
636 |
258 |
109 |
|
glass1 |
32 |
28 |
32 |
24 |
327 |
260 |
230 |
176 |
|
Mean |
2335 |
1873 |
1465 |
521 |
79596 |
76565 |
68174 |
17737 |
|
Median |
93 |
79 |
77 |
50 |
924 |
704 |
910 |
552 |
This table can be downloaded as an Excel document or as a CSV file by
clicking on the following links ![]() and
and ![]() .
.
Table 22. p-values adjusted with the Bergman-Hommel post-hoc procedure for the C4.5-based and CHAID*-based algorithms for the Time measure
|
|
PART_C45 |
BFPART_C45 |
UnPART_C45 |
CHAID* |
PART_CHD |
BFPART_CHD |
UnPART_CHD |
|
C4.5 |
1 |
1 |
1 |
4.12E-12 |
0 |
0 |
0 |
|
PART_C45 |
1 |
1 |
8.23E-11 |
0 |
0 |
0 |
|
|
BFPART_C45 |
1 |
3.06E-10 |
0 |
0 |
0 |
||
|
UnPART_C45 |
4.47E-10 |
0 |
0 |
0 |
|||
|
CHAID* |
.0000318 |
.0000032 |
.0000014 |
||||
|
PART_CHD |
1 |
1 |
|||||
|
BFPART_CHD |
|
|
|
|
|
|
1 |
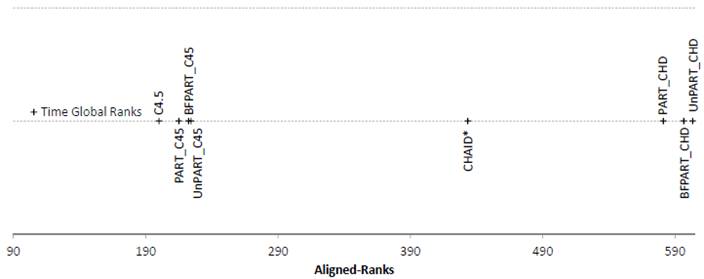
Figure 5. Friedman Aligned Ranks for the C4.5-based and CHAID*-based algorithms for the Time measure